
 Whether you believe the catastrophic predictions being made by some scientists, or prefer the lower key approach of others, there’s no doubt the world is heading for uncertain times, thanks to our misuse of resources, primarily over-consumption of ‘fossil’ fuels. But we can ALL do something about it.
Reducing or eliminating car use
Motor vehicles are a very real problem. More than a quarter of all CO2 put into the atmosphere in the UK comes from transport, and nearly all of that from the road transport sector. A typical two-car household will consume 77 kW of energy per DAY just running the cars. That’s more than the energy consumption of a typical home. Just think about that for a minute – we are using more energy travelling around than we are cooking, bathing, keeping our houses light and warm, watching TV and every other power-consuming activity. There are many ways to reduce your reliance on the car. We use bicycles for short journeys, and the train for long journeys. In between, we use electric bicycles and folding bikes that can be carried by train or bus. By these means, we have more or less eliminated our transport energy consumption.
A folding bicycle enables you to integrate your life with often irregular and poorly integrated public transport. For more information, we suggest starting with the page Why Choose a Folding Bike? More recently, electric-assist bicycles have begun to make a real impact. Many people have now swapped a second car for an electric-assist cycle. For more information, we suggest starting with the page Why Choose an Electric Bike?
Reducing energy use in the home
By a number of measures we reduced the energy consumption of our home (plus the A to B office and all electric bicycle charging) from the national average of about 70 kW to 22.5 kW per day. More information can be found in A to B 53 – see Back Numbers for more information.
Generate your own power
Not as easy as it sounds, but in July 2006 we moved house and our new home had an unshaded south-facing roof, making it ideal for Solar Photovoltaic panels that generate electric power from the sun. Once again, full details in A to B 56, see Back Numbers for more information.
Obviously moving house caused a great deal of disruption (and extra CO2!), but things soon settled down. We fitted cavity wall insulation, loft insulation and double glazing, and in mid-October 2006 our Solar PV roof came on stream with the roofersdublin.net dublin services. There were still many problems – our wood-burner was not yet fitted and we were cooking electric while the gas supply was sorted out (this would run on for months), but the table below indicates our daily energy usage when the PV was first fitted. Total electricity consumption is something of an estimate, because our digital house to grid meter is unable to run backwards, so we have to estimate how much power is being exporting to other nearby houses. We’ve assumed that about 3kWh of our daytime power generation is actually being used in the house, with the remainder being exported. On this basis (reasonably accurate) we have done quite well, actually crossing the barrier into carbon neutrality in the first week of April 2007. Since then, we have regularly crossed that magic barrier in June, July and August.
Our Average Daily Power Consumption
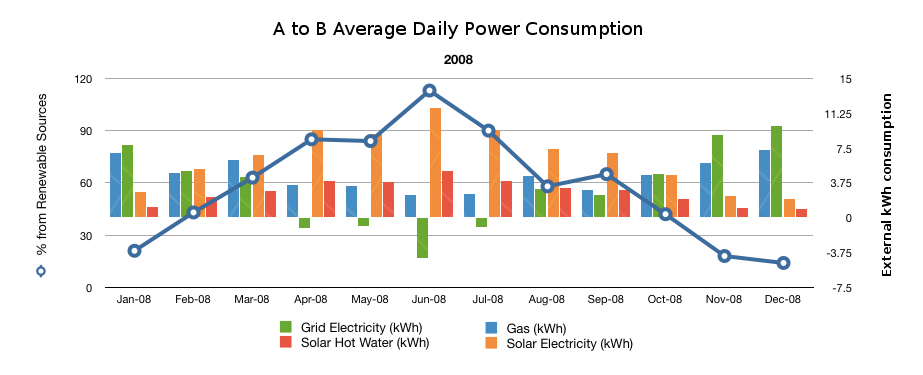
Average Daily Power Consumption
| Month / Year | Notes | Gas (kWh) | Grid Electricity (kWh) | Solar Electricity (kWh) | Solar Hot Water (kWh) | Total Per Day (kWh) | % from Renewables | Running Annual Average |
| October 2006 | We had inherited an inefficient gas central heating system, which accounts for almost all of that 29 kW a day, despite sparing use. The good news is that our wood burner was finally installed on 4th November, and the central heating was finally turned off. October is a bad time for Solar PV, but the last week was very good, and for the three weeks the solar PV was in operation, we generated 30% of our electric power this way. How will the woodburner get on? How much sunshine will we see? Find out next month! | 29.0 | 7.6 | 3.0 | – | 39.6 | 8% | – |
| November 2006 |
Wow! What a difference a month makes! The woodburner has proved up to the task of heating the whole house, and runs well on recycled timber of various kinds. This has more or less eliminated our gas useage (we only turn the boiler on for baths). It’s also been a good month for PV. The result is 16% (plus the wood, of course) from renewable sources. | 8 | 10.1 | 3.7 | – | 21.8 | 17% | – |
| December 2006 |
A miserable month. Very little sun and increasing electricity consumption. The only good news is that the gas boiler has barely been used at all. | 1.5 | 10.9 | 1.6 | – | 14 | 11% | – |
| January 2007 |
Continuing nasty weather, but it’s a amazing how a few bright mornings can generate a lot of PV power, keeping the percentage up despite growing demand. Over one weekend, we produce more than 10 kW. Our overall electricity consumption is up however – partly space-heating in a child’s bedroom, but also our new dishwasher! Can we bring consumption back down? | 2.3 | 14.1 | 2.3 | – | 18.7 | 12% | – |
| February 2007 |
Some scientists think the recent pattern of hot summers and cold, wet, stormy winters will become the norm. If so, our power generation will be very seasonal! Despite some terrible weather, there were a handful of clear, bright days in February, some producing in excess of 10 kW. The mean of 4.3 is a big advance, and with slightly lower demand, helped to push the solar contribution up to 25%. | 2.5 | 9.3 | 4.3 | – | 16.1 | 27% | – |
| March 2007 |
Interesting to see solar energy double in February and double again in March. Despite rather high consumption, that’s enough to get us very close to 50% from solar. Incidentally, if the energy useage seems high, it covers our business, home and all electric bike transport, so pretty low considering. We’re working hard to cut household and office consumption. | 1.8 | 2.3 | 8.6 | – | 12.7 | 68% | – |
| April 2007 |
Super-fine weather in early April resulted in a week or so when we were net exporters of energy, but across the month as a whole, we narrowly failed to beat that 100% target. All the same, 98% from renewable sources overall is quite good going for the time of year. | 1.24 | -1 | 10.6 | – | 10.8 | 98% | – |
| May 2007 |
A mixed bag of weather in May drops our home generation total. But towards the end of the month we install three Schott solar water panels to back up the PV and replace our aging gas boiler with a new condensing boiler designed to accept solar pre-heated water . This should reduce our energy consumption further, but will we simply use more of this wonderful new source of hot water? | 1.7 | -0.5 | 9.6 | – | 10.8 | 89% | – |
| June 2007 |
New boiler and new pre-heating panels have meant a bit more luxury, and a near halving of our gas consumption. Disappointingly, two weeks of terrible weather knocked back our solar power from what should have been the best month of the year. | 0.99 | -0.7 | 8.7 | – | 9 | 97% | – |
| July 2007 |
These figures are a little difficult to interpret: SOLAR ELECTRICITY: It was one of the wettest (and darkest) Julys on record – solar electricity generation was lower than it might have been! GRID ELECTRICITY: With builders working in the house almost every day, baking for a family party and other odds and ends, we used more grid electricity than we might have expected, but overall consumption is down because part of the load for the dishwasher, washing machine and shower is now provided by gas GAS: The new pre-heating boiler works well, and has reduced electricity demand, but we’re using more gas! Some fine-tuning might be useful : On hot days, hot water is supposed to flow from the solar tank direct to the taps, leaving the boiler off. It does, but the boiler often cuts in unnecessarily. Something to look into when the last bits of plumbing arrive SOLAR HOT WATER: Overall energy consumption appears to be up, because we’ve recorded the amount of solar hot water produced, which has little to with the amount used. The process of getting energy from the roof to the bath is rather inefficient, but it’s free energy, and even if we only manage to use a quarter of it, we’re still cutting our fossil fuel consumption. By managing the solar supply better, we should be able to improve on these figures! |
1.4 | -1.6 | 9.3 | 4 est | 13.1 | 102% | – |
| August 2007 |
Our best ever result, thanks to two weeks of more or less unbroken sun. All the same, the days are getting shorter, so we have to expect lower power figures from now on. | 0.8 | -1.9 | 9 | 3.9 | 11.8 | 109% | – |
| September 2007 |
Oh dear! Not a good month for various reasons. Builders still using a lot of power, which explains our relatively high electricity consumption, but the gas is a bit of a mystery. One possibility is that we’re simply using the solar system to have more hot baths! | 2.9 | 1.8 | 7.9 | 3.4 est | 16 | 71% | – |
| October 2007 |
This is more the sort of thing we were hoping to achieve. Producing 50% of your energy from renewable sources in October really is not bad in the UK. Gas consumption is still higher than we hoped, but it’s good to see the solar water still coming on stream almost every day, pre-heating the cold feed water. | 3.4 | 3.5 | 4.8 | 2.1 | 13.8 | 50% | 62.6% |
| November 2007 |
The lack of pre-heat to the water tank (zero on many damp, dark days) shows in the higher gas consumption. And it’s been a bad month for solar electricity too. All things considered, we’re lucky to have produced 25% of our energy. | 5.1 | 7.4 | 2.9 | 1.3 | 16.7 | 25% | 63.3% |
| December 2007 |
Several changes – a new more efficient washing machine, and a new gas/electric cooker, instead of the electric only model. And a pretty miserable month. | 6.3 | 8.2 | 1.6 | 0.7 | 16.7 | 14% | 63.5% |
| January 2008 |
A new baby has added a lot of extra energy consumption in the short-term. For two or three nights, we kept the central heating on, and of course, there’s a lot more washing! The other change, just noticeable in the figures, is a new gas/electric hybrid cooking stove. As we were previously all-electric, this has increased gas consumption a little and reduced electricity use by about the same amount. | 7 | 7.8 | 2.8 | 1.2 | 18.8 | 21% | 64.3% |
| February 2008 |
Not a warm and pleasant month, but plenty of sharp, cold frosty mornings. These are good for us, because the solar water and PV panels work extremely well, even with temperatures near or below freezing. | 4.8 | 5.0 | 5.2 | 2.2 | 17.2 | 43% | 65.6% |
| March 2008 |
Disappointingly high gas and electricity consumption this month. Hard to explain, but a baby means a lot of washing, and we used the central heating on two days – it’s a bit scary how fast the gas consumption can rise with just a few hours of central heating | 6.2 | 4.4 | 6.8 | 2.9 | 20.3 | 63% | 65.2% |
| April 2008 |
That’s a bit more like it, but we will have to get used to the idea of our consumption being higher now there are four of us. | 3.5 | -1.1 | 9.4 | 4.0 est | 15.8 | 85% | 64% |
| May 2008 |
Slightly down due to grotty weather. | 3.4 | -0.9 | 9.0 | 3.8 | 15.3 | 84% | 63.7% |
| June 2008 |
Excellent weather and our best solar month yet. | 2.4 | -4.3 | 11.8 | 5.0 | 14.9 | 113% | 65% |
| July 2008 |
Weather going downhill again. Gas consumption is stubbornly high – bit of a mystery, because the new cooker uses gas only for the rings, and the boiler should be pretty efficient. Electricity use is low, despite all the washing and cooking. | 2.5 | -1.0 | 9.4 | 4.0 est | 14.9 | 90% | 65% |
| August 2008 |
An appalling month – cloudiest August for 40 years, hence the very poor results. Add on considerable extra energy consumption for various reasons and it’s by far the worst result we’ve ever seen in August, and broadly similar to March. | 4.5 | 3.1 | 7.4 | 3.2 | 18.2 | 58% | 64% |
| September 2008 |
Better weather, but too late in the summer to make much of it. Our consumption remains stubbornly high, but that’s the impact of having a baby in the house, and a bigger busier office. | 3.0 | 2.4 | 7.0 | 3.0 est | 15.4 | 65% | 65% |
| October 2008 |
Better weather, but too late in the summer to make much of it. Our consumption remains stubbornly high, but that’s the impact of having a baby in the house, and a bigger busier office. | 4.6 | 4.7 | 4.6 | 2.0 | 15.9 | 42% | 59% |
| 2008 Nov | A miserable month. | 5.9 | 8.9 | 2.3 | 1.0 | 18.1 | 18% | 59% |
| December 2008 |
A relatively good month for solar power production, especially the PV panels which like the very cold weather we’ve been having, but the cold weather has meant several boosts from the gas-powered central heating, and entertaining at Christmas has added extra dishwasher use, and extra electricity consumption from other sources too. All things considered, we’ve done well to produce 14% of our power. | 7.3 | 9.9 | 2.0 | 0.9 | 20.1 | 14% | 58% |
| Jan, Feb, Mar 2009 |
Everything thrown at us, from snow to a big freeze, but some lovely sunny days too, so quite a good result. | 5.3 | 5.0 | 5.0 | 2.3 | 17.6 | 41% | 58% |
![]()